arrow_back home

NFL Play-by-Play Analysis with Java and JDBC

The NFL database analyzes play-by-play data to uncover trends in player performance, team strategies, and game dynamics. It highlights patterns such as play type effectiveness, player contributions, and situational tendencies, providing actionable insights for a deeper understanding of the sport at a granular level.

AT A GLANCE FRAMEWORK AND WORKFLOW NUTS AND BOLTS CONNECTION AND DATA FUTURE
arrow_drop_down

AT A GLANCE

Key insights into player performance are revealed through a function that analyzes a quarterback's completion rate by field area, highlighting the top target for each zone. For example, Josh Allen has a high number of pass attempts deep right and deep left, despite a low success rate in those areas.


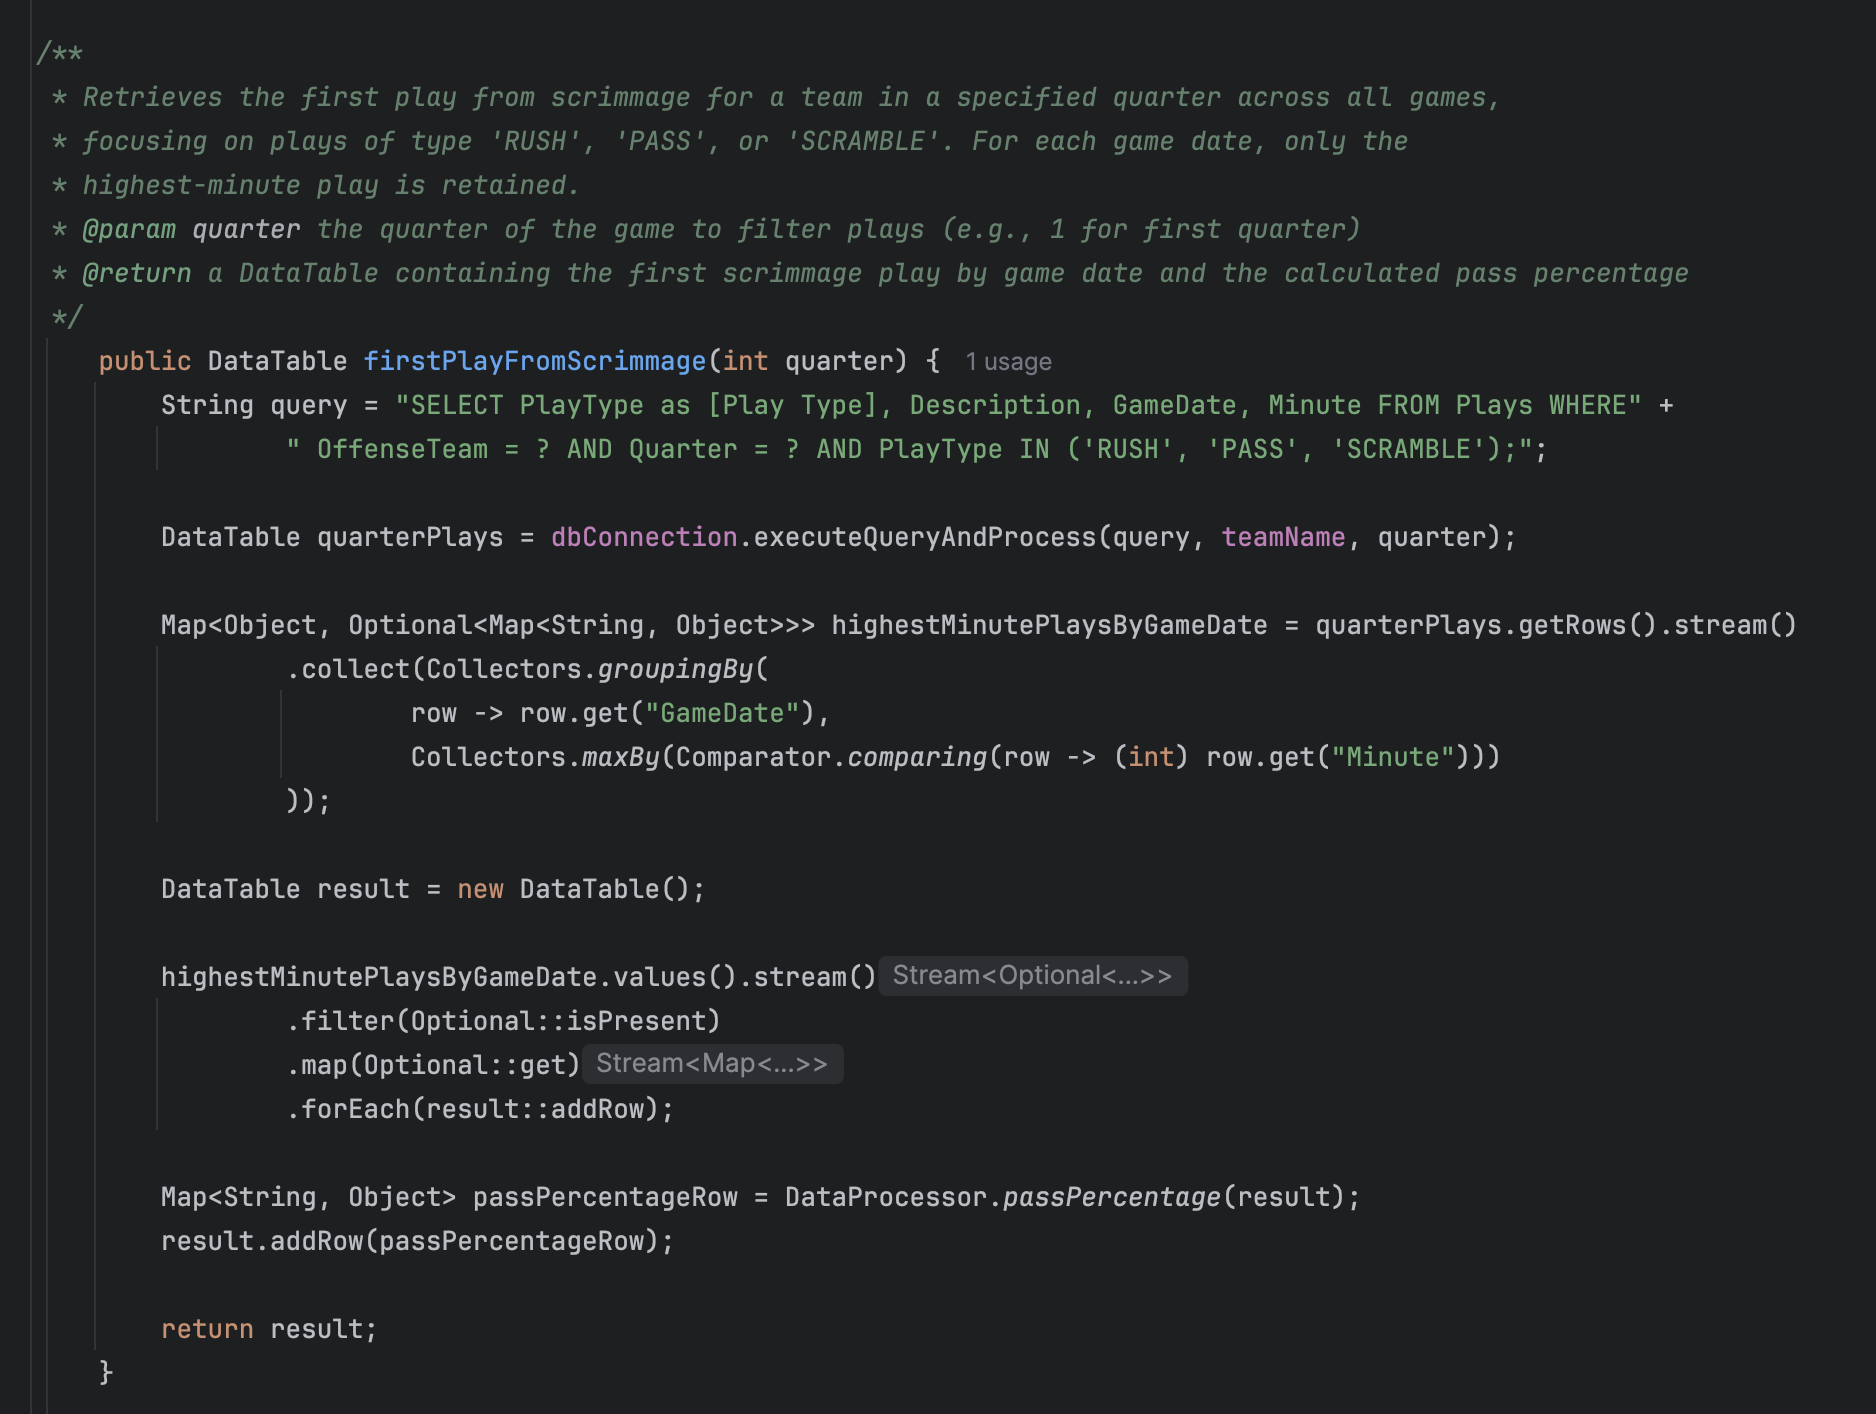
Beyond individual statistics, specific trends emerge in less commonly analyzed scenarios. The "first play from scrimmage" function shows the Eagles consistently turning to Saquon Barkley for their first offensive play of the second half, whether through a pass or a run.


* The displayed output is based on data from up to Week 9 of the 2024-2025 NFL season, although the database is updated weekly for up-to-date analysis.


FRAMEWORK AND WORKFLOW

The Analytics class dynamically determines and executes specific analyses like team, player, or game insights based on user input. Each analysis class encapsulates its tasks, querying the database for relevant data, which is processed by a DataProcessor to apply Java logic and structured by a DataTable for easy consumption.

Results are returned to the central Analytics class and displayed to the user via a dedicated Display module. This modular design keeps tasks well-organized, encapsulated, and ensures flexibility, scalability, and maintainability.


method

NUTS AND BOLTS

ThefirstPlayFromScrimmage method uses a parameterized SQL query to filter plays by team, quarter, and play types (`RUSH`, `PASS`, `SCRAMBLE`). The query results are processed with Java streams, grouping plays by `GameDate` and selecting the play with the highest `Minute` in each group using `Collectors.maxBy`. Additional metrics, like pass percentage, are calculated with `DataProcessor.passPercentage` and appended to the dataset. The final result is organized in a `DataTable`, maintaining consistency for further processing or display.


CONNECTION AND DATA

The Connections class manages database connectivity by opening a JDBC connection, maintaining the connection object, and securely disconnecting when operations are complete.

Data is manually imported from a CSV file into the database, with plays broken into 41 columns, including key fields such as Description, Penalties, and Yard Lines, among others. Over 50,000 rows of data are processed in under two seconds.


FUTURE ENHANCMENTS

-> A machine learning model to predict player performance and game outcome.
-> Enable side-by-side comparisons of players or teams across multiple metrics for detailed analysis.
-> Interactive Dashboard - interface with charts, graphs, and tables to visualize data intuitively.
-> A system to automatically fetch and import weekly CSV file.

Any questions?

Shoot me an email!
Back to the top arrow_upward